Search “Pocket Option strategy” and you will find hundreds of videos promising 95% win rates. The reality: binary options are a probability game, and the traders who last are the ones with clear entry rules, sensible expiry times and strict risk limits. Below are five strategies that beginners can actually follow on pocketoption — each with the indicator settings, timeframe and expiry we recommend — plus the money-management framework that ties them together.
Before the strategies: three rules that apply to all of them
- Trade with the trend of the higher timeframe. If the 15-minute chart is rising, look only for Buy signals on the 1-minute chart.
- Choose assets with a payout of 80%+ (shown next to the asset name). At 80% payout you need to win about 56% of trades to break even.
- Avoid the first 5–10 minutes after major economic news and the very quiet Asian session hours, when spreads widen and price moves randomly.
Strategy 1: EMA 9/21 trend following
Two exponential moving averages show the short-term trend. When the fast EMA (9) is above the slow EMA (21) the trend is up; you buy on pullbacks to the EMA 9. When it is below, you sell on rallies back to the EMA 9.
| Setting | Value |
|---|---|
| Indicators | EMA 9 and EMA 21 |
| Timeframe | 1 minute (or 5 minutes for calmer entries) |
| Expiry | 3–5 candles (3–5 min on M1) |
| Buy signal | EMA 9 > EMA 21, price touches EMA 9 and prints a bullish candle |
| Sell signal | EMA 9 < EMA 21, price touches EMA 9 and prints a bearish candle |
| Skip when | EMAs are flat and intertwined (no trend) |
Strategy 2: support and resistance bounce
Price tends to react at levels where it reversed before. Mark the last 2–3 swing highs and lows on the 5-minute chart with horizontal lines. When price returns to a level and forms a rejection candle (a pin bar or engulfing candle), enter in the direction of the bounce.
- 1Draw horizontal lines at clear recent highs and lows (at least two touches).
- 2Wait for price to reach a level — do not anticipate.
- 3Confirm with a rejection candle: long wick into the level, close back inside.
- 4Enter with an expiry of 3–5 candles. Skip the trade if the candle closes beyond the level (possible breakout).
Strategy 3: RSI reversal (overbought / oversold)
The Relative Strength Index measures momentum. Readings above 70 suggest the asset is overbought, below 30 oversold. On its own RSI gives many false signals in a strong trend, so use it in ranging markets or as a filter for the two strategies above.
| Setting | Value |
|---|---|
| Indicator | RSI, period 14 (or 7 for faster signals) |
| Timeframe | 1–5 minutes |
| Expiry | 2–3 candles |
| Buy signal | RSI drops below 30 and then crosses back above 30 |
| Sell signal | RSI rises above 70 and then crosses back below 70 |
| Skip when | A strong one-directional trend is in progress (RSI stays pinned above 70 / below 30) |
Strategy 4: MACD crossover
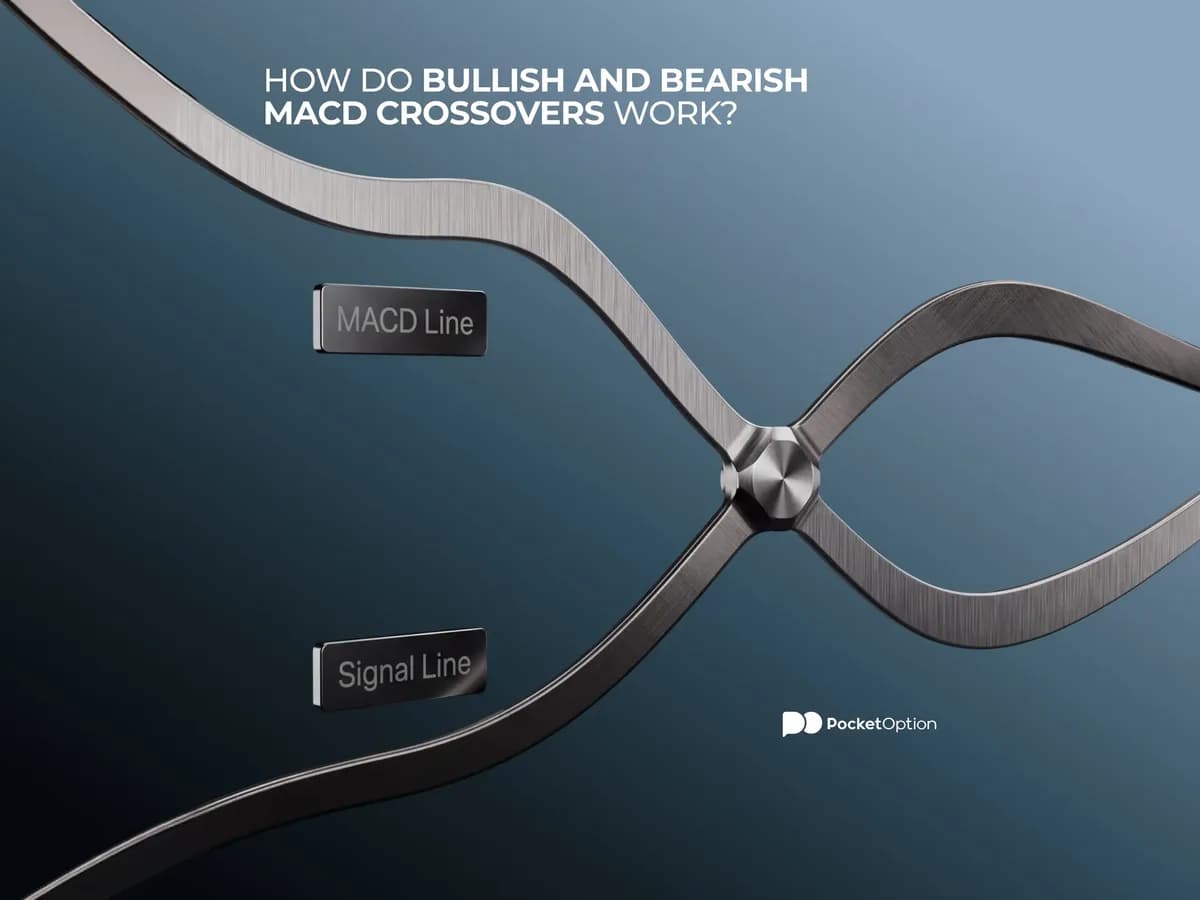
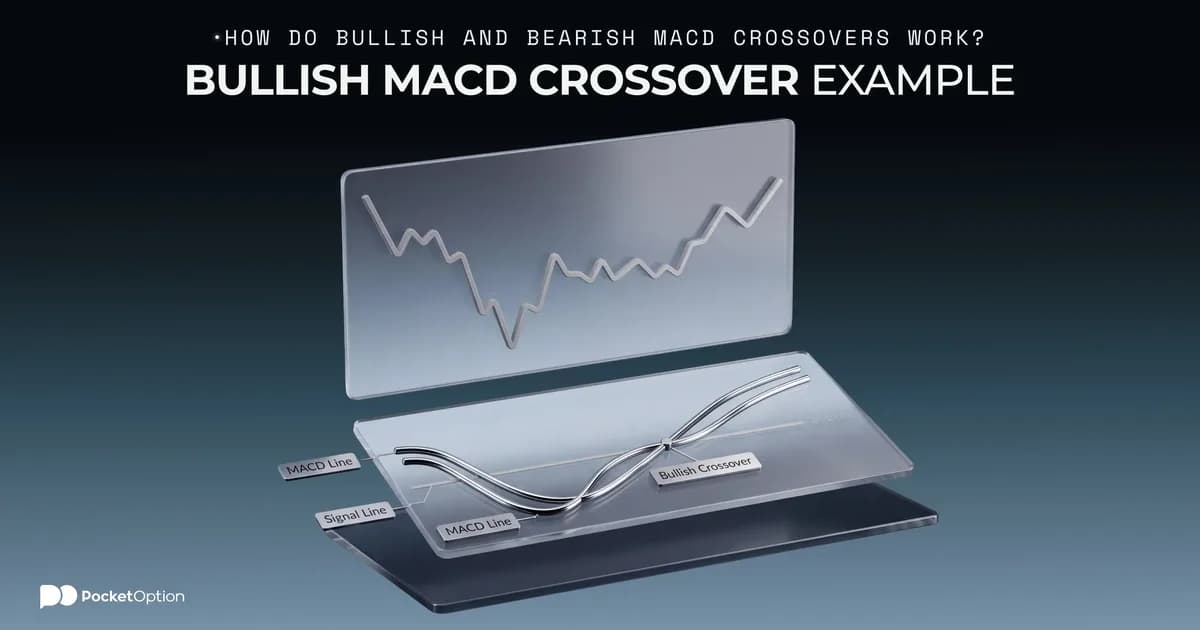
MACD (12, 26, 9) combines trend and momentum. A bullish crossover happens when the MACD line crosses above the signal line; a bearish crossover when it crosses below. The best signals occur when the crossover agrees with the direction of the EMA trend and the histogram starts growing.
- 1Add MACD with the default settings 12 / 26 / 9 on the 5-minute chart.
- 2Wait for the MACD line to cross the signal line and for the candle to close.
- 3Check the higher timeframe (15 min): trade only crossovers in that direction.
- 4Enter with an expiry of 3–5 candles (15–25 minutes on M5).
Strategy 5: consolidation breakout with confirmation
When price moves sideways in a narrow range for 10–20 candles, it is storing energy. A breakout from that range often continues for several candles. The trap is the false breakout — so enter only after the breakout candle closes outside the range and, ideally, after a small retest of the broken level.
- Timeframe: 1–5 minutes; expiry: 3–5 candles.
- Range must be clearly defined: at least 10 candles between two flat levels.
- Confirmation: a full-bodied candle closing outside the range with rising volume (if the asset shows volume).
- Never trade breakouts during major news — spikes reverse in seconds.
Money management: the part most beginners skip
A 60% win rate with poor money management still empties the account. Use fixed fractional sizing: risk 1–2% of your balance per trade, always the same amount. With a $100 balance that is $1–$2 per trade — which Pocket Option allows, since the minimum trade is $1.
| Rule | Why |
|---|---|
| Risk 1–2% per trade | Survives losing streaks; 10 losses in a row cost only 10–20% |
| Stop after 3 losses in a row | Prevents revenge trading when the market or your focus is off |
| Daily loss limit 5–6% | Caps a bad day; come back tomorrow |
| Never use martingale (doubling after a loss) | A few losses in a row exceed your balance or the maximum trade size |
| Keep a trade journal | Only way to know which strategy actually works for you |
How to test a strategy on Pocket Option
- 1Open the free demo account ($50,000 virtual balance).
- 2Choose one strategy and one asset (e.g. EUR/USD) — do not mix.
- 3Make at least 50 trades following the rules exactly, logging each result.
- 4Calculate the win rate. You need about 56% at 80% payout; aim for 60%+ before going live.
- 5Move to a real account with a small deposit ($10–$50) and the same 1–2% risk.
Test these strategies without risk: the Pocket Option demo has the same charts, indicators and quotes as the real account.
Open free demo